What is Performance Testing
-
Performance testing evaluates how well a system behaves under a specific workload. It ensures the speed, scalability, and stability of an application.
-
The objective is to identify bottlenecks, optimize response times, and ensure systems perform under various conditions.
Performance Metrics
- Response Time
- Throughput
- Latency
- Resource Utilization
Time taken to respond to a user’s request.
In software and web applications, it's the time between:
A user making a request. ie: Clicking a button or sending an API call.
The system returning a response. ie: Loading a page or delivering data.
Number of requests processed within a given time.
Usually measured as Requests per second (RPS) or transactions per minute / hour.
In API testing, if your server handles 100 requests in 10 seconds, throughput = 10 requests/second.
In performance testing, with JMeter or LoadRunner, throughput tells how many users or requests your system can support efficiently.
Delay between request initiation and response.
It’s the "wait time" before the actual data starts transferring.
For example, you send a request to a server. The server takes 50ms before it starts sending back the first byte, that 50ms is the latency.
Usage of CPU, memory, disk, or network resources.
Common types:
CPU utilization - % of CPU capacity being used.
Memory utilization - % of RAM used by processes.
Disk I/O utilization - How actively the disk is reading / writing data.
Network utilization - Bandwidth usage over time.
High resource utilization can lead to slow response times, errors, or even system crashes, especially under load.
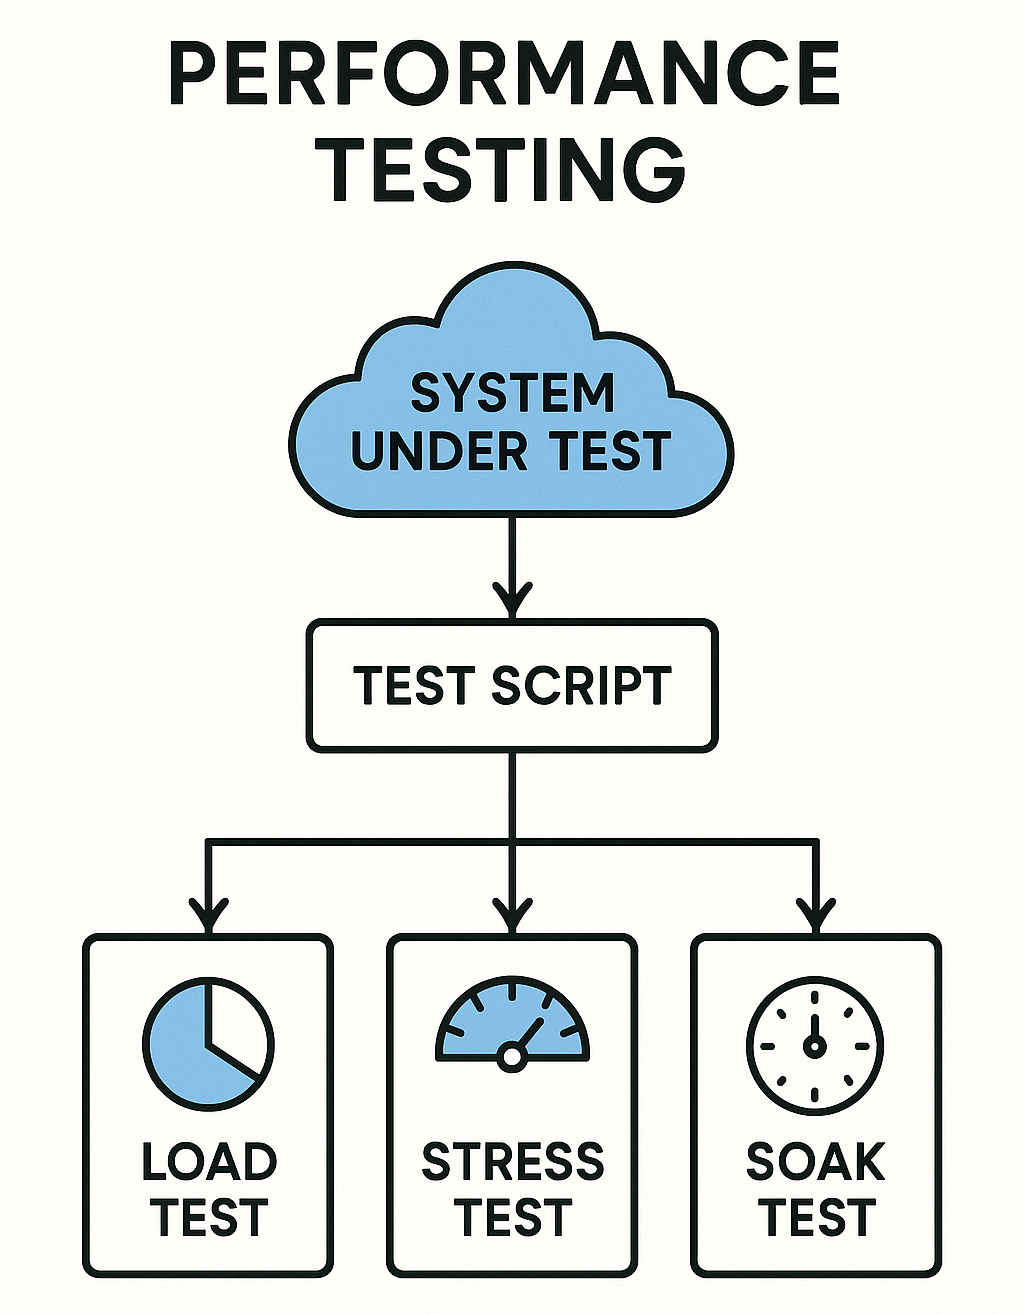
Types of Performance Testing
- Load Testing
- Stress Testing
- Spike Testing
- Scalability Testing
- Endurance (Soak) Testing
Measure the system's performance under expected user loads.
The purpose is to identify:
Handle expected traffic volume.
Maintain performance. ie: Response time and Throughput.
Stay stable under normal conditions.
For example, If the app is designed for 500 concurrent users, you simulate 500 users doing typical actions. ie: Browsing and Purchasing and then monitor:
Response time.
Error rate.
Resource utilization.
It helps ensure good user experience during daily peak usage, not just under ideal or extreme conditions.
Determine the system's stability under extreme or unexpected workloads.
The purpose is to identify:
Identify the breaking point and see how the system fails. ie: Gracefully or not.
Test recovery mechanisms.
Uncover bottlenecks (CPU, Memory, and DB).
For example gradually increase the number of users or requests until, the response time becomes unacceptable, errors spike, and the system crashes.
This helps ensure that the system can handle unexpected heavy loads, fails predictably, and recover without data loss.
Test the system’s response to sudden increases in traffic.
The purpose is to identify:
System stability during spikes.
Recovery time after the spike.
Whether the system crashes or gracefully handles overload.
For example, the system usage suddenly jump from 100 users to 1000 users within seconds, then drop back down. The following needs to be observed:
Response time
Errors
System crashes or slowdowns
Resource spikes (CPU, Memory, and Disk)
This essential for apps with unpredictable traffic. ie: Ticket sales and Live streams.
Assess how performance changes when the system is scaled up or down.
The purpose is to identify:
Determine maximum capacity.
Identify performance bottlenecks.
Check how performance changes as the system scales up ie: Vertical Scaling or scales out ie: Horizontal Scaling.
Vertical Scaling - Means adding more power ie: CPU, RAM, Storage to an existing server to handle increased load.
Horizontal Scaling - Means adding more machines ie: Servers or Instances to handle increased load, instead of making a single server more powerful.
For example, start testing with 100 users, then increase to 500, 1000, and beyond. You monitor response time, throughput, and resource utilization to see how the system behaves.
It helps ensure your app won’t fail or slow down when traffic spikes. ie: Flash sales and Product launches.
Verify the system’s ability to handle prolonged usage without degradation.
The purpose is to identify:
Memory leaks
Performance degradation
Database connection leaks
Resource exhaustion (CPU, Memory, Disk)
For example You simulate 100 users accessing your app continuously for 12 hours. The goal is to see if the system remains stable or starts to slow down, crash, or behave unpredictably over time.
- It’s useful for system before production releases and for systems that must run continuously. ie: Banking, E-commerce, and SaaS.
Performance Testing Tools
JMeter
-
JMeter is an open-source tool to simulate multiple users and test web applications.
-
JMeter may be used to test performance both on static and dynamic resources, Web dynamic applications.
-
It can be used to simulate a heavy load on a server, group of servers, network or object to test its strength or to analyze overall performance under different load types.
-
Supports HTTP, HTTPS, databases, and REST APIs.
LoadRunner
-
LoadRunner is an Enterprise-grade tool for testing large-scale applications.
-
Supports various protocols (HTTP, FTP, WebSockets, etc.).
-
Generates detailed reports on bottlenecks and system performance.
Gatling
-
Gatling is a Scala-based tool for performance testing of APIs.
-
Focused on high throughput and concurrency testing.
k6
-
k6 is a modern, scriptable load testing tool.
-
Integrates well with CI/CD pipelines and DevOps tools.
Performance Testing Strategies
-
Test Early - Integrate performance tests in the development phase.
-
Simulate Realistic Workloads - Use data that mimics actual user behavior.
-
Baseline Testing - Establish baseline performance to compare future changes.
-
Monitor Resources - Track CPU, memory, and network usage to detect bottlenecks.
-
Analyze Results - Look for trends, response time spikes, or throughput issues.
Module Review
Click to start the definition to term matching quiz
Click to start the multiple choice quiz
Score: : 0 / 20 [0.00 %]
Question 1 of 20: If a server handles 100 requests in 10 seconds, what is the throughput?